A lot of the statistics about radon testing is based on US EPA national data from the 1980s and 1990s. At Raleigh Radon, we compile the data of all the local, Triangle-area radon tests that we conduct. The information below is from our 2018 data.
There are two primary factors that impact the radon levels (or predicted radon levels) of a home - foundation type and location (geology of the soil in the area).
Foundation Type
We've categorized the foundation types into the five types in the chart below. The majority of homes built in this area (59% of the homes we tested in 2018) have crawlspace foundations.
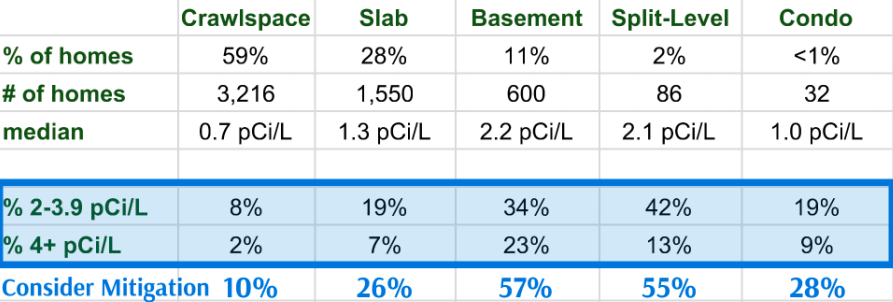
As you can see, the majority of basement and split-level homes had radon levels high enough to consider mitigating. Overall, regardless of foundation type, 10-57% of the homes we tested in 2018 needed to consider having a mitigation system installed based on having results of 2 pCi/L or higher.
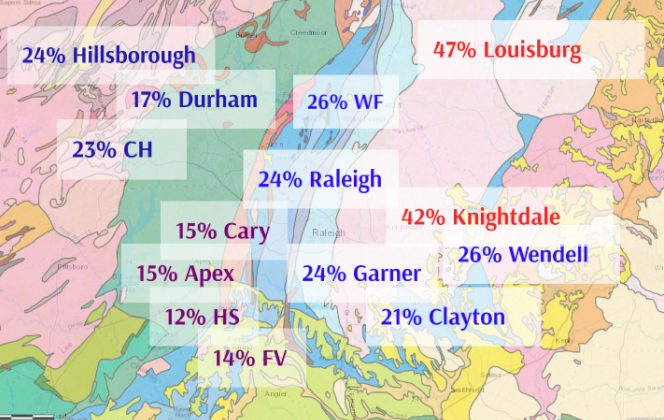
Location (Geology)
Overall, 20% of the homes we tested in 2018 had results of 2 pCi/L, the level at which the EPA recommends at least considering mitigation. Due to the geology of the soil in the area, different cities (and areas within those cities) had varying rates of homes with elevated radon levels. The statistics shown in the picture below are the percentage of homes within that city that had results of 2 pCi/L or greater.